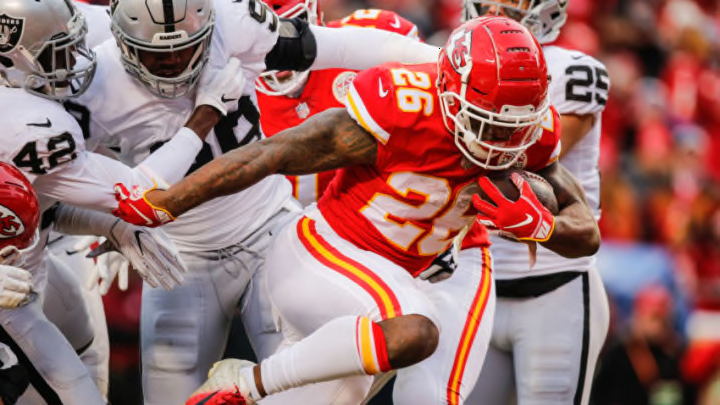
Much of the offseason talk about the Chiefs offense centers around Patrick Mahomes, Tyreek Hill and the passing attack, but what about the run game?
The Kansas City Chiefs have one of the NFL’s most prolific offenses. The offense is built around the incredible talent of quarterback Patrick Mahomes and the play calling of head coach Andy Reid. Reid has long been seen as an offensive mastermind whose playbook started as a variation of the West Coast Offense of Bill Walsh and has evolved into a hybrid of the West Coast Offense and more of a college style spread offense system. This passing attack has made stars not just out of the reigning MVP like Mahomes, but also guys like tight end Travis Kelce and wide receiver Tyreek Hill (we’ll just avoid the discussion of his current situation for today). However, the area of K.C.’s offense that often gets overlooked is the running game.
When Reid came to Kansas City, we were all told to forget about running the football because Andy loves to pass—that we should essentially brace ourselves for screen passes to replace handoffs going forward. While Reid certainly is a fan of throwing the football, his track record of running the football in Kansas City has actually been pretty strong.
In his six seasons as the Chiefs head coach, Reid’s teams have ranked anywhere between 6th-16th in the NFL is rushing yards per game. While the Chiefs may not have been at the very top of the league in rushing under Reid, they have maintained a run game that is somewhere in the upper half of the NFL.
So is that what we should expect again in 2019?
Despite a lot of change over in running backs over those six seasons (featuring the likes of Jamaal Charles, Charcandrick West, Spencer Ware, Kareem Hunt, Damien Williams, and even quarterback Alex Smith) the results have remained fairly consistent. Here are the carries per game, yards per game, yards per carry, and rushing touchdowns for each of Reid’s six seasons in K.C.
- 2013: 27.6 carries, 128.5 yards, 4.7 YPC, 17 TDs
- 2014: 26.2 carries, 119.9 yards, 4.6 YPC, 18 TDs
- 2015: 27.2 carries, 127.8 yards, 4.7 YPC, 19 TDs
- 2016: 25.8 carries, 109.2 yards, 4.2 YPC, 15 TDs
- 2017: 25.3 carries, 118.9 yards, 4.7 YPC, 12 TDs
- 2018: 24.2 carries, 115.9 yards, 4.8 YPC, 16 TDs
That’s an average of about 26 carries, 120 yards, 4.6 YPC, and 16 TDs. History says that even if the run game is down a little bit this year, it will still be relatively close to those numbers. It’s really just a matter of which running back or backs get that production. This isn’t even including passes caught by the running backs which we know can be a regular part of a Reid offense. For the purpose of this post we are just talking about actually running the football.
So which backs are most likely to get the bulk of this production? Let’s start with the back that ended the season as KC’s top back and will likely start the season there as well.
